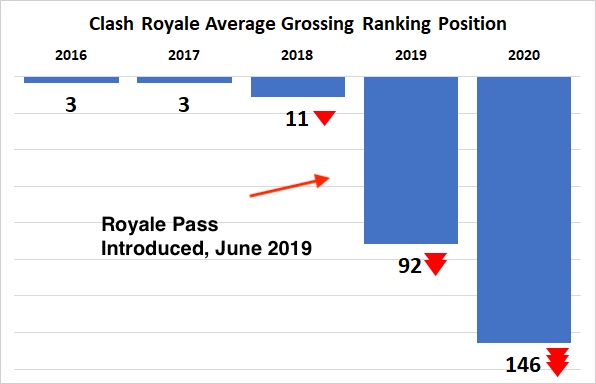
Monetization’s modern paradigm is defined by a direct store and battle pass (BP). After years (and ongoing) criticism of loot boxes, Fortnite re-wrote the rulebook in a way that seems to make both developers and players happy. However, it’s important to consider that at sufficient scale any monetization scheme looks like a winner. It’s unclear if Fortnite is a winner because of the pass or despite it. For instance, the collapse of Clash Royale’s monetization can be partly traced to the introduction of its own pass.
Reports of the death of loot boxes have been greatly exaggerated as well. Of top 10 grossing free-to-play games, 8 sold loot boxes in some form. Of the top 10 premium games, 4 did. It’s going to take more work to dislodge the loot box paradigm.
And it’s understandable. If a developer isn’t going to reach Fortnite scale, battle pass isn’t a sufficient monetization solution. But it doesn’t have to be this way. We’re in the early innings of BP; by breaking down the model we can pivot the pass from an engagement to monetization driver.
The Model
We now have a model to compare different passes. Let’s examine Fortnite, Valorent, Call of Duty Warzone and Dota 2.
| Game | ADMC | Total Cap | Entry Cost | Tiers | Tier Cost | Pass Length |
|---|---|---|---|---|---|---|
| Fortnite | $1.90 | $160 | $10 | 100 | $1.50 | 84 Days* |
| Valorant | $1.50 | $85 | $10 | 50 | $1.50 | 56 Days |
| Warzone | $2.86 | $160 | $10 | 100 | $1.50 | 56 Days |
| Dota 2 | $6.39 | $1,010 | $10 | 2,000 | $0.50 | 158 Days |
| 100 HC = $1 | *12 weeks avg. |
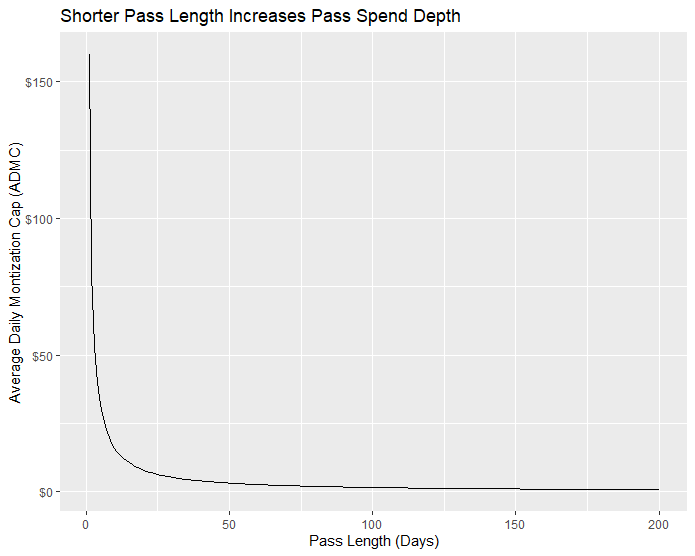
Each game has a widely different approach. Some go for more tiers and longer length while others go for less tiers and shorter season length. While not accounted for above, it is also important to adjust for pass frequency over a year long period. Dota 2 has a 200% increase in ADMC over Fortnite, but Valve only releases the pass once a year. Warzone, on the other hand, maintains a 100 tier season over an 8 week span consistently. This would average 5-6 passes a year. Nonetheless, battle pass presents far less spend depth over other monetization vectors. In a loot box system, the spend cap is the average price price to unlock all content. In a direct store, the cap is correlated to the total sum of prices divided by the rotation cadence. In almost all games this puts ADMC north of ~$20.
However, we’ve still failed to account for opportunity costs to paint a complete profit maximizing picture.
The Pivot
Marginal Pricing
BP tier pricing is plagued by inconsistency. Most games use exponential time to complete curves, with each level taking more XP (and therefore time) to complete then the prior one. Here’s Fortnite chapter one, season four as an example:
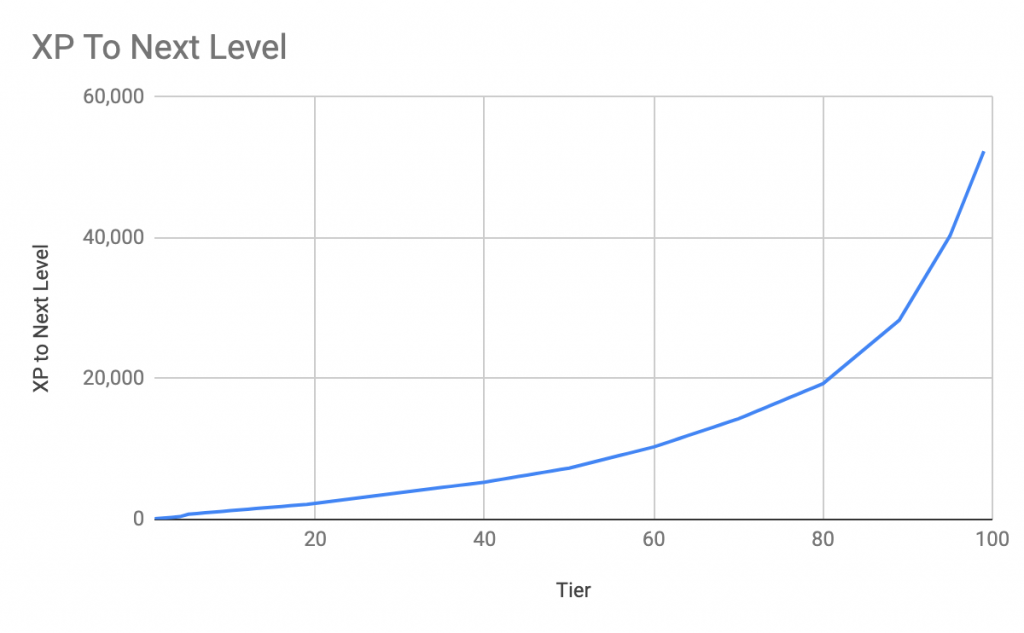
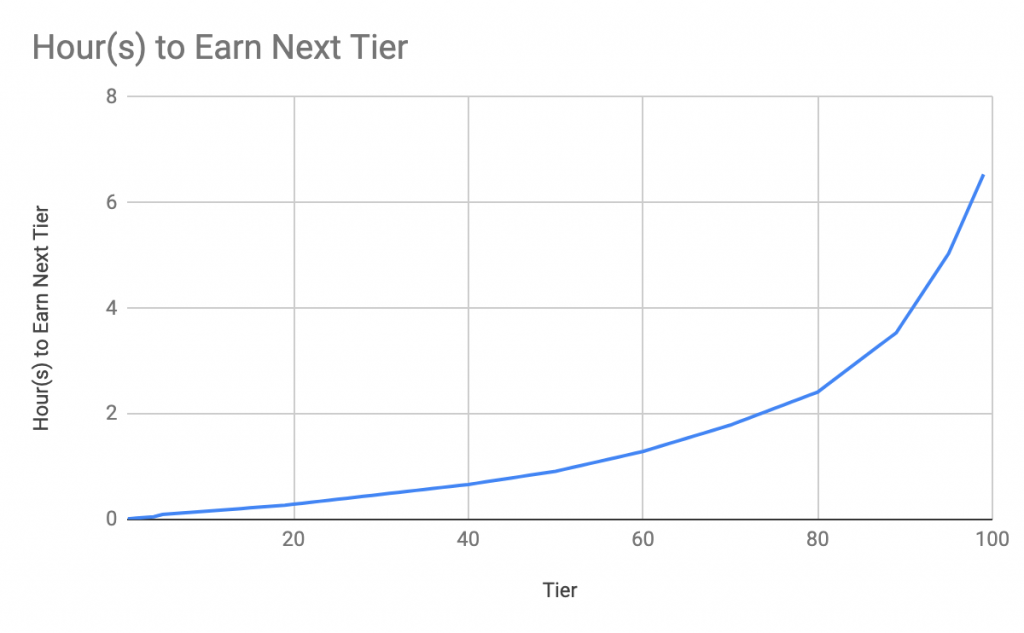
And unlike RPGs, XP earn rate does not generally increase overtime. Yet, tier price is constant at $1.50 despite increasing XP requirements and constant earn rates. This is a rather odd proposition as it suggests that the usual $1.50 tier price forgoes a differing amount time depending on the tier number. By dividing by average time to earn we can understand the cost of an hour forgone per tier number. For example, tier 100 may take 6.5 hours to earn, and with a price of $1.50 this means the player pays $0.23 per hour if they choose to purchase the tier ($1.50/6.5hr to earn). Tier 1 only takes 12 minutes, suggesting a hourly price of $120 ($1.50/0.125hr to earn)!
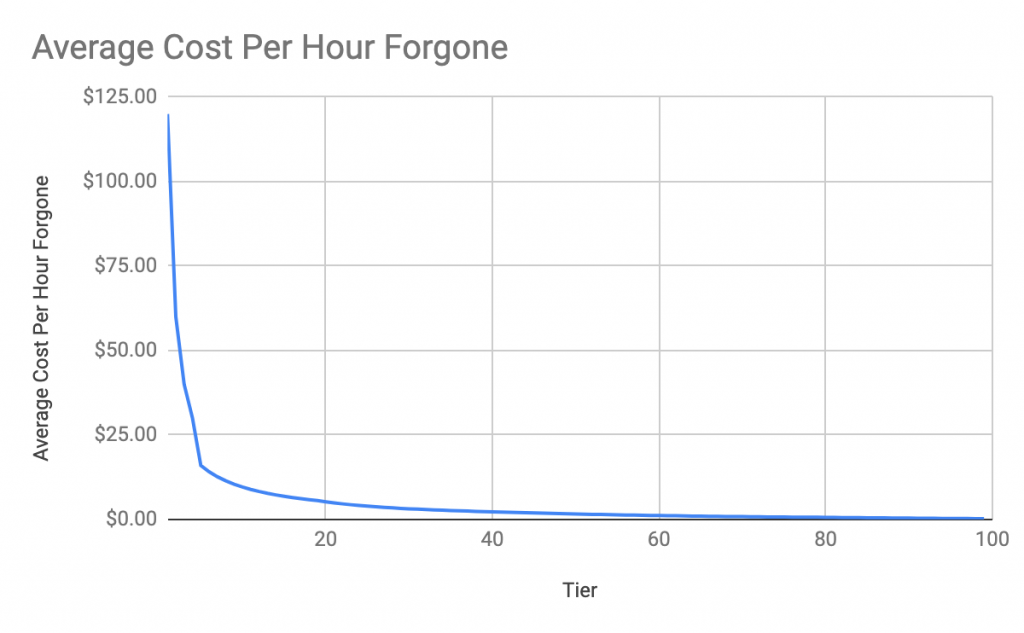
This incentivises players to withhold tier spending until the end of the season.
More bang per tier buck. Yet players who make it to the end of the season are the most price inelastic! Why not vary tier price to maintain a constant benefit? Here’s what this’d look like assuming $1.50 buys 6,000 XP instead of a fixed tier:
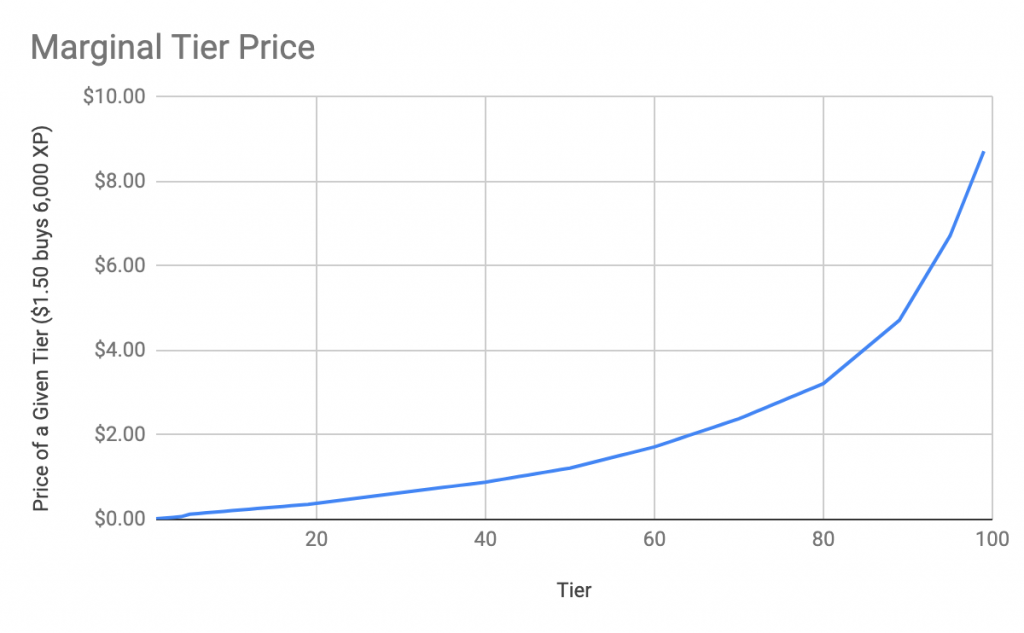
Tier 1 would cost $0.10 since it forgoes very little time while tier 99 would be $9.00 since it forgoes over 6 hours.
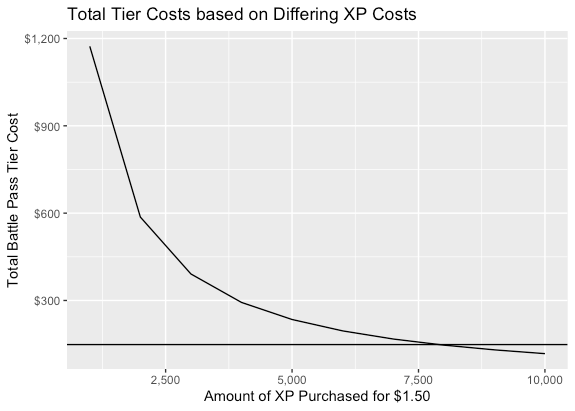
I chose 6,000 XP to illustrate, but any amount can be chosen as the constant. At around 7,000 XP per $1.50, marginal tier pricing produces a greater spend depth then constant tier pricing (99 tiers at $1.50 = $148.50 spend cap).
This also combats the sunk cost problem. If a player is in the middle of a long tier, the price to complete the tier remains constant in hard currency. Purchasing a tier doesn’t always boost a player to the same “spot” in the next tier. In that case, it’s easy to feel like the early XP earned in the long tier is “wasted” if the player is considering purchasing the tier outright.
Setting the optimal XP/tier price is an exercise in price elasticity. If we set a tier price to say, $10,000, almost no player would buy tier. On the other hand, a price of $0.01 would produce very little revenue. Therefore, there exists a revenue maximizing amount of XP at a given price. While we may not know this exact number, it’s likely to be higher then current prices may suggest.
Tier UX
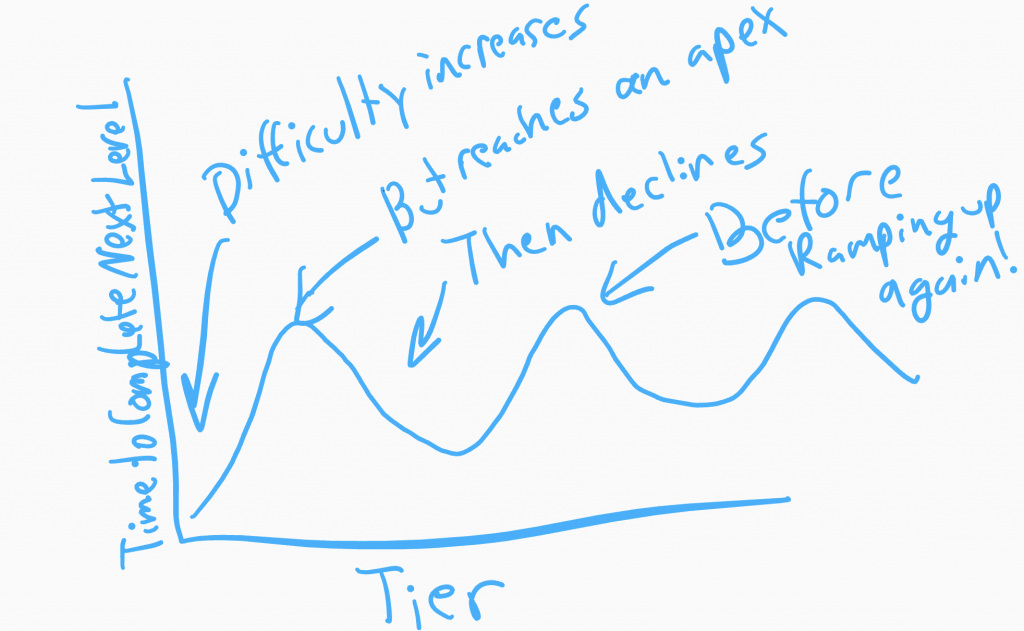
Moving to marginal tier pricing puts much more pressure on the UX wrapper. Frustratingly, despite exponential time to complete, nearly every pass displays the distance between levels as constant. All of these levels in Apex look just as easy/hard as one another:
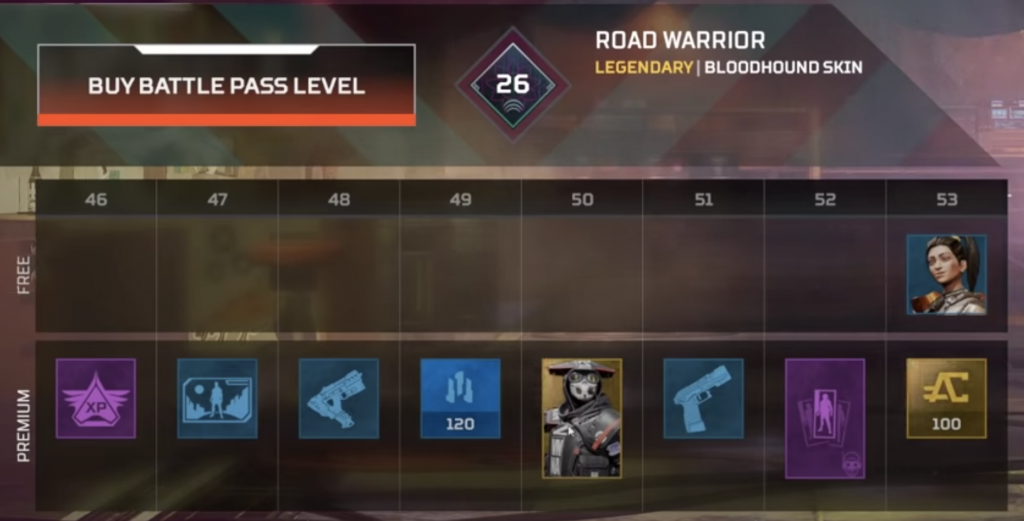
There are two solves for this: (1) alter tier distance (increase spacing between levels consistent with XP required) and/or (2) hard level labeling.
First used by King’s groundbreaking experimentation team, hard level labeling simply labels a label as hard (as long as it actually is). This encourages booster spend by a significant margin, as it tells players it’s optimal spend in the level. This has spread to other match-3 titles and now we find super hard levels.
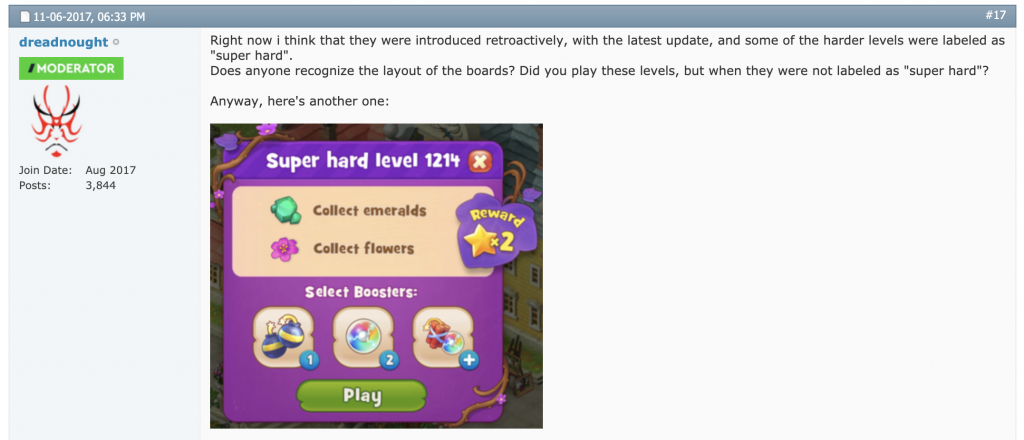
Simply labeling a BP tier as hard should produce the same effect. This becomes a bit trickier for exponential curves as all the hard levels are backloaded. Shifting to an s-curve design avoids this as well as being a more equitable distribution of rewards.
More Tiers or Less Days
A simple way to increase ADMC is increase the cadence of the pass. Instead of 12 weeks to complete, refresh the pass after 8 weeks. In Fortnite’s case this would increase ADMC by ~50% ($1.90 to $2.86). We can model the marginal effects of changing the pass refresh rate:
Adding more tiers produces a similar effect but in reverse. Instead of 100 tiers, why not Dota’s 2,000? Cost and smart use of content plays a strong role.
Alter Cost Profile
Shortening cadence or adding tiers runs into supply side problems. There ain’t no such thing as free content. Furthermore, it’s wise to consider the vector with the highest return per price of content: does adding an Epic outfit to the direct store produce more marginal revenue then adding it to the BP? But even before answering that question we need to consider the cost of producing items all together. Despite Epic employing hundred of employees and engaging in outsourcing, ~12% of tiers in the pass are “costless”. This means they consist of either currency or boosters rather than distinct items.
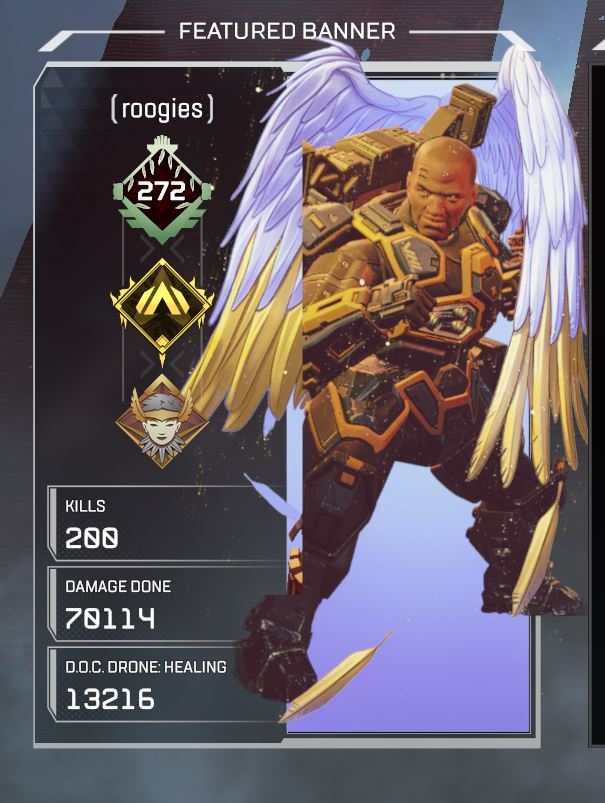
Having cheap items altogether is another avenue. Apex has mastered this. Consider the stat tracker: it’s simply a tally of a particular stat. Or loading screens: an old piece of 2D art. This type of content is extremely cheap to produce. The foundational conversations of a game economy should include content vector specifications.
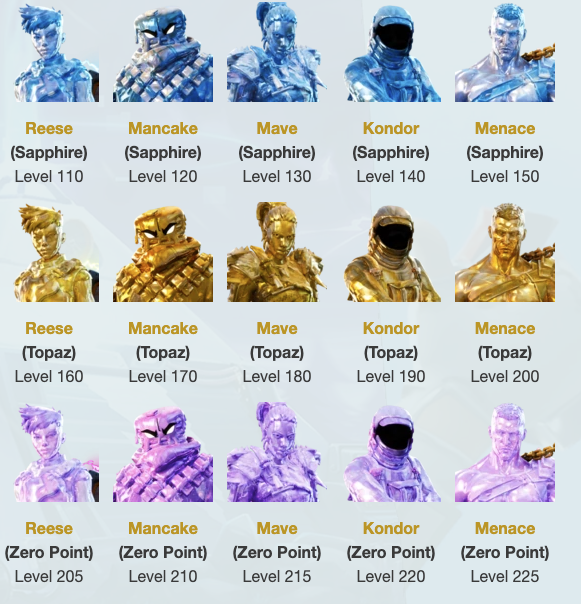
Valve has employed clever use of changing colors on cosmetics and Fortnite adopted something similar in their new crystal levels.
Where To
MTX design has evolved and there’s no reason to think BP won’t do the same. At the end of the day, it’s a mechanic not a destiny. In future posts, I’ll expand on pivoting the pass even more. This is just an appetizer.